
Microsoft Power BI is the best analytics tool on the market. With the use of Power BI, Microsoft has placed the ability to develop complex reports in the hands of the lay user.
A cornerstone of this application is its ease of use. Power BI’s “drag and drop” interface and other instruments allow for the user to create analytical reporting in only a few minutes.
Within the past year, Microsoft has gone the extra mile in making this business tool even easier to use. This is all thanks to the additions made to the Power BI Desktop interface.
The “Customize” Pane

Developers are of course familiar with the Desktop’s “Filters”, “Build”, and “Data” panes. Clicking  offers the “Customize” Pane.
The “Add or remove panes” section provides quick access to Data, Build, Format, Copilot, Bookmarks, Selection, Performance analyzer, and Sync slicers:

Data, Build, and Format are enabled, in this instance of Desktop.
New Shortcuts
The objects on the Power BI canvas contain two new shortcuts – Suggest a visual and Add to your visual.
Suggest a Visual
Based on the fields that you have placed on the Canvas, Power BI makes intelligent suggestions as to which Visualization should be used.
In addition, selecting Arrange data for me enables Power BI to provide proper placement of these fields into each axis.

Also, each of the bottom two buttons displays Small multiples and Tooltips.
Add to Your Visual
In this stacked column chart Title, Zoom slider, Ribbons, and Data labels are available for the Power BI developer:

Small Multiples
The “Small multiples” feature splits a visual into multiple versions of itself. Using a chosen dimension, the versions appear side by side with data divided across these versions. Here, the aggregated amount of revenue displays based on the day of the week:

Tooltips
The “Tooltips” feature shows additional data, when the user hovers over a column in the Visualization:

Zoom Slider
The zoom slider allows the user to zoom in on any part of the data. The axis will automatically scale to the user’s selection: 
Ribbons
Ribbons gives an expanded view of the data, by showing the amount of change between values. This example’s Tooltip shows not just the amount of revenue for Wednesday and Thursday but the difference in revenue between the two days:

Data Labels
Data labels make data interpretation easier, by showing exact amounts for each day of the week:

More Options
Clicking the “More options” button simply displays Power BI’s “Format” pane.
Easy Selection of Visualizations
No more hovering over the icon of a Visualization just to find out what it represents!
Hit the drop-down button in the “Insert” section of Power BI’s Ribbon, to find Visualizations grouped based on the purpose served:
Turning On the New Interface
To enable the features discussed in this article, navigate to File…Options and settings…Options and select Preview features on the left:
The “On-object interaction” box is unchecked, by default. Check this box.
Click OK, when prompted for a restart:
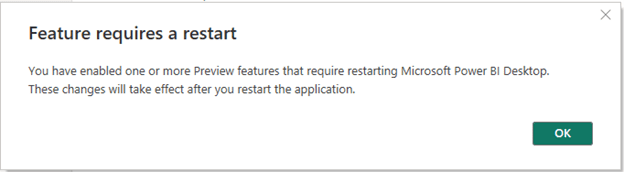 Finally, exit the Power BI Desktop. Upon reopening, these features will be available.
For more information about Power BI or Dynamics 365 you can reach out to us at Sales@BondConsultingServices.com or you can click here to schedule a free consultation with one of our Dynamics experts. Alternatively, you can always visit our YouTube channel for helpful video walkthroughs and recorded webinars.