Simple Object Designer (SOD) in Dynamics 365 Business Central provides an intuitive interface for users to customize their dashboards and reports without using Application Language. This tool creates queries for pivot tables and other reports within Business Central’s user interface.
We recently customized this report for a client:

SOD Bookmark
SOD is found by clicking the “Search” button in Business Central:

Tip: Instead of clicking the link for Simple Object Designer as shown above, select the “Bookmark” icon to the right. Doing so will place a bookmarked link for SOD on Business Central’s Role Center. Rather than searching for SOD every time that you need to create or modify a customization, simply click the bookmarked link for one-touch access to SOD!
Data Mining
Within SOD’s home screen, click Data Queries:

Clicking New in the “Query List” screen allows for the creation of the query:

Since the user wanted to utilize this sales query’s data as a basis for creating new purchase orders, we chose “Sales” as the Query Category and simply named the query “PO”.
Clicking ![]() pulls up the “Query Card” screen.
pulls up the “Query Card” screen.

After choosing the necessary tables and SQL Join Type such as LeftOuterJoin within the “Query Card” screen, selecting a table and clicking Columns allows you to choose which columns to use within the query:

Simply selecting “Yes” in Included in Query is all that’s required for displaying that column in the query.
Although choosing a Method isn’t necessary, you may do so if aggregations such as “SUM” are required.

Clicking Filters links the tables and does so, based on a common field:
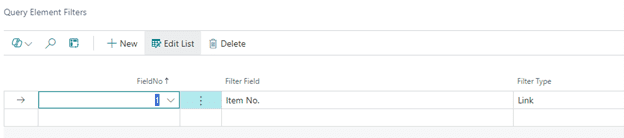
In this case, choosing Item No. as the “Filter Field” links the “Sales Line” and “Sales Price” tables.
The “Filter Field” for linking the “Sales Price” and “Item Substitution” tables is No.
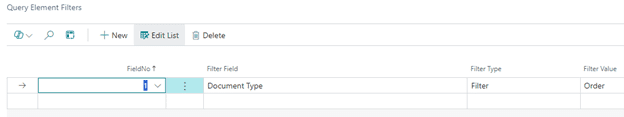
This “Query Element Filters” screen, also, allows you to display only Sales Order documents from the “Sales Line” table:
Publishing and Viewing the Query
Returning to the home screen for SOD, clicking “Publish”, and clicking the subsequent “Yes” button creates the query.
Once again, click Business Central’s “Search” button.
Simply type “po”, within the search field:
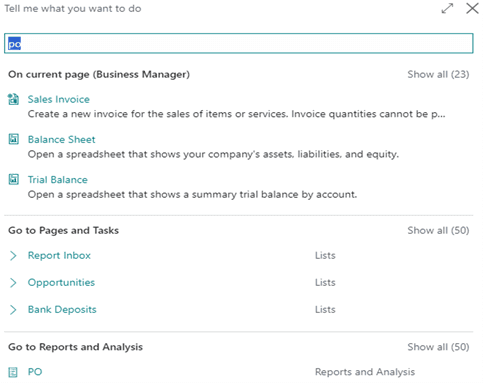
Clicking “PO” at the bottom displays our query:

Within just a few minutes, we’ve created a comprehensive query for reporting without writing a single line of code!
Creating a Business Central Pivot Table
Let’s take this a step further. Yes, this data may be exported to Microsoft Excel just like any other data in Business Central. Instead, we’ll take advantage of Business Central’s new Analysis Mode feature.
Enter Analysis Mode, by clicking the “Analyze” button ![]() found in the top left-hand corner of the “PO” query.
found in the top left-hand corner of the “PO” query.
Use Row Groups and other selections within the resulting pivot table, to group the Sales Orders based on Sell-to Customer No.:
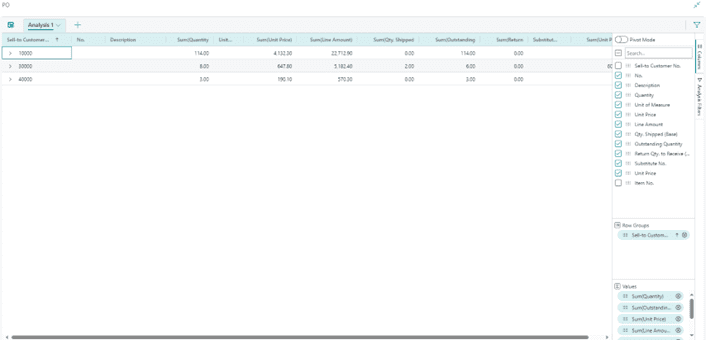
Then, you may click any of the “greater than” signs to display Sales Orders and other data for each customer:

Final Consideration
SOD should be installed and used, only within a Sandbox environment. In a Sandbox, development may be conducted without risk to Production.
Once testing is complete, SOD generates an extension (i.e., a .app file) for uploading into Production.
For more information about Simple Object Designer or about Dynamics 365 Business Central, feel free to reach out to us at Sales@BondConsultingServices.com or you can click here to schedule a free consultation with one of our Dynamics experts. Alternatively, you can always visit our YouTube channel for helpful product videos and recorded webinars.