Transforming Data into Decisions for Modern Businesses
Organizations using Microsoft Dynamics 365 Business Central generate significant volumes of financial and operational data. However, collecting data is only the first step. The real value lies in effective data analysis and reporting within Business Central — transforming raw transactions into actionable insights that support better business decisions.
Enter Business Central Analysis Mode a powerful built-in feature within Microsoft Dynamics 365 Business Central that is reimagining the way businesses interpret, dissect, and act upon their financial and operational data.
What Is Business Central Analysis Mode?
Business Central Analysis Mode is an interactive tool embedded directly within list pages of Microsoft Dynamics 365 Business Central. It enables users to dynamically analyze data, create ad-hoc reports, and visualize trends without needing to leave the application or rely on external tools like Excel or Power BI.
Designed for both financial and business users, Analysis Mode offers a self-service approach to data exploration, allowing teams to make better, faster decisions.
Key Features of Business Central Analysis Mode
In-Page Analysis: Users can analyze data directly on list pages—such as General Ledger Entries, Sales Orders, and more—without exporting data or losing context.
Drag-and-Drop Functionality: Columns can be reorganized, summarized, and broken down with intuitive drag-and-drop gestures, making exploration seamless and interactive.
Aggregations and Pivoting: Summarize information by dimensions, apply filters, and pivot data to view it from different angles, like Excel pivot tables.
Save and Share Views: Custom analysis views can be saved and shared with colleagues for consistency and collaboration.
Real-Time Data: Since Analysis Mode operates within Business Central, it always reflects up-to-date, live data, ensuring that analysis is grounded in the most current information available.
No Technical Skills Required: The design targets users with a business background, making advanced analysis accessible to everyone without specialized data skills.
How to Use Analysis Mode
Using Analysis Mode is straightforward:
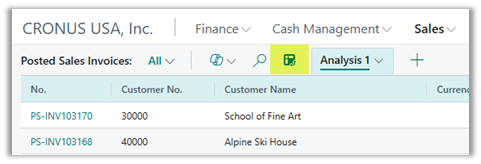
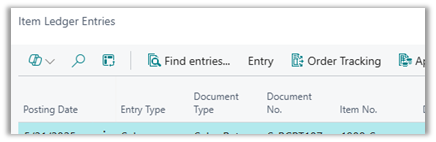
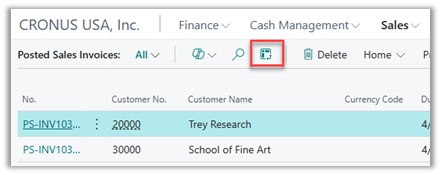
Navigate to a List Page: Open any supported list page within Business Central, such as Posted Sales Invoices or Item Ledger Entries.
Enter Analysis Mode: Click the Analysis Mode button (often a chart or graph icon) to shift the page into analysis mode.
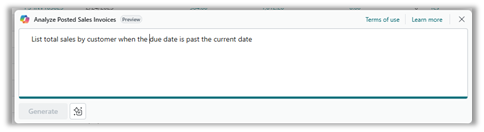
Interact with Data: Reorganize columns, remove columns, apply sums or averages, filter records, and group or pivot your data using intuitive controls. Alternatively, use Copilot to create a new analysis. Describe in natural language what you want to achieve and let Copilot suggest a few options. Use the Copilot Prompting guide to create more accurate analysis.
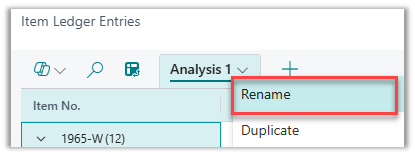
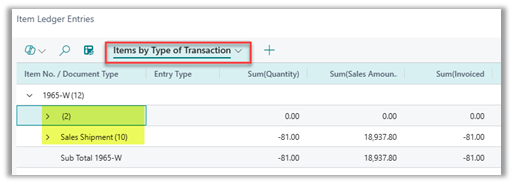
Save or Share Your View: Save your custom view as a reusable analysis or share it with team members to standardize reporting. Use Rename to name the view with a descriptive name, such as “Items by Type of Transaction.“
In the Rename prompt, enter the name, and select Rename.
Why Use Analysis Mode Instead of Excel or Power BI?
Business Central Analysis Mode supports fast, in-application data exploration. For day-to-day reporting—such as reviewing sales trends, analyzing General Ledger Entries, or summarizing Item Ledger activity—the built-in analytics within Microsoft Dynamics 365 Business Central are often sufficient. Users can filter, group, and pivot data directly in the system without exporting to Excel or relying on external tools.
When reporting requirements involve cross-system data modeling, advanced visualizations, or complex KPIs, Power BI is typically the better fit. It enables broader data integration and enterprise-level dashboards across multiple data sources.
A key advantage of Analysis Mode is speed. Because it operates directly within Business Central, users analyze live data instantly—without refresh delays or managing separate datasets.
From a governance standpoint, in-app analysis ensures a single source of truth. There is no version confusion, no spreadsheet manipulation, and no reliance on outdated exports. The result is faster insight with greater data reliability.
Business Central Reporting Examples
Sales Performance
The sales team needs to compare quarterly results across regions. Analysis Mode enables users to pivot sales figures by region, product, or customer segment, instantly revealing trends and outliers.
Start from the Customer Ledger Entries
Activate the Analysis Mode by clicking on the Analysis Mode icon.
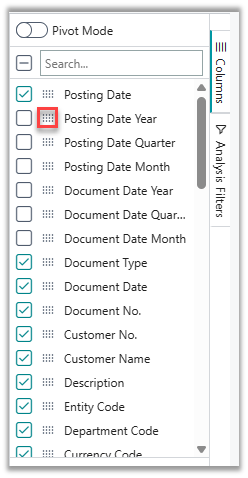
Use the Columns section to add or remove columns, reorganize them, or drag them to the Row Groups or Values sections. Hint: Use Personalize to add missing columns or use Profile Customization to add other columns not available using Personalize.Select or deselect columns and use the 12-dots icon to drag fields to other places, like a different position, or to the Row Groups or Values sections, where you can aggregate the data.
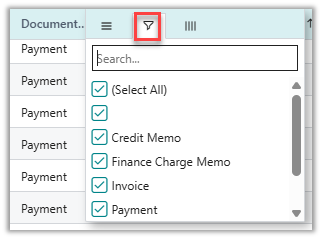
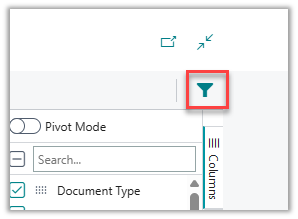
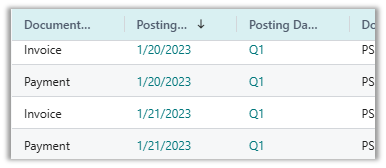
Add filters and sorting: To limit the data you want to see and sort them in ascending or descending order.On each header, click the menu (represented by three parallel lines) and select the funnel icon. Select or enter the values to filter by.Regular List filters are also available by using the funnel icon on the upper right corner, which is the standard Business Central filters.
You can sort most columns by clicking the header, which will reverse the sorting to ascending, descending, or no sorting. Ascending and descending sorting are indicated by their corresponding arrows, and no arrow means no sorting.
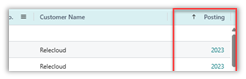
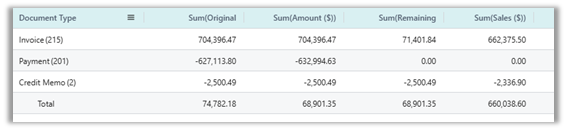
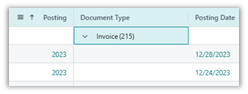
Use the Pivot Mode: To see values only for the selected Row Groups. Pivot Mode removes texts, descriptions, and any non-numerical fields.Any other non-numerical field, when selected, will become part of the Row Groups, or they can be dragged into the Column Labels section to name the columns. For example, drag the column “Posting Date Years” and BC will display the yearly totals.
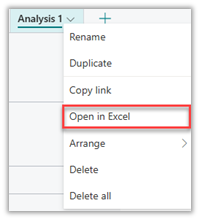
Export to Excel: Once the Analysis View is ready and you are satisfied with the data you see on screen, click on the chevron next to the view and select Open in Excel.The resulting file is a snapshot of what you see on screen. You can further modify the file and format it as desired.
Analysis Mode Menu Functions
Rename: names or renames a view.
Duplicate: to create a copy of a view.
Copy Link: to share a view by generating a link.
Open in Excel: Opens the current view in Excel.
Arrange: to move a tab left or right.
Delete: To delete a view.
Delete all: To delete all views.
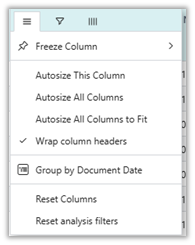
Header Options
Freeze Columns: to turn off a Freeze or Freeze to the left or right of the selected column.Freeze left will send the column to the left of the page.
Freeze right will send the column to the right of the page.
Autosize Columns: on any header, select the menu icon and select an autosize option:
Autosize This Column
Autosize All columns
Autosize All Columns to Fit
Autosize will consider the visible data to autosize columns.
Wrap column headers: On any header, select the menu icon and this option to make headers easy to read when columns are narrow.
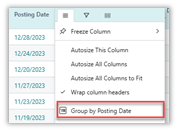
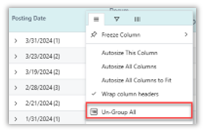
Group or Ungroup Columns: On any header, select the menu icon and choose from two possible values:a. Group by [Field name] to add the field to the Rows Groupsb. Un-Group All: to ungroup all fields added to the Rows Groups.
Reset Columns: On any header, select the menu icon and this option to reset the view to match the original list.
Reset Analysis Filters: On any header, select the menu icon and this option to reset any filter added by the user.
Best Practices for Analysis Mode
Start Simple: Begin with basic aggregations and filters before layering on more complex pivots and calculations.
Leverage Dimensions: Make use of Business Central’s dimension feature to analyze data by cost center, region, or other relevant tags.
Validate Data Regularly: Since the analysis is real-time, always ensure that the underlying data is accurate and up to date.
Collaborate: Share your views and insights with colleagues to encourage a data-driven culture across departments.
Explore Frequently: Do not hesitate to experiment with new groupings or breakdowns, you never know what insights await!
Limitations and Considerations
While Analysis Mode is a powerful tool, it does have a few constraints:
It is optimized for in-page analysis rather than large-scale data visualization—more advanced reporting may still require Power BI or similar tools.
Analysis Mode works best on supported list pages, so not every data set in Business Central is immediately available for analysis.
Complex calculations or custom KPIs may need to be created outside Analysis Mode.
Turning Business Central Data into Actionable Insight
Business Central Analysis Mode is a significant change for organizations looking to leverage their data without technical barriers. By putting analysis tools directly in the hands of everyday users, it fosters a culture of curiosity, accountability, and agility. Whether you are in finance, sales, or operations, Analysis Mode empowers you to move from data to decisions with confidence and speed.
If your team is exploring Microsoft Dynamics 365 Business Central reporting capabilities or looking to optimize how your organization uses Analysis Mode, Bond Consulting Services can help. Our team works with finance and operations leaders to design practical reporting strategies that support confident decision-making. Contact us →
Bond Consulting Services (BCS) has partnered with RUX Software to deliver equipment rental and asset management capabilities for small and mid-sized businesses running on or moving to Microsoft Dynamics 365…
What AI Agents in Dynamics 365 Actually Do (A Plain-English Guide)
Upcoming Lunch & Learn — See AI in Manufacturing WorkflowsJoin us for a 30-minute Lunch & Learn on February 26th, where we’ll walk through practical manufacturing scenarios and explore how…
D365 Business Central: Realistic AI Agent Scenarios for Operations Teams
Upcoming Lunch & Learn — See AI in Manufacturing WorkflowsJoin us for a 30-minute Lunch & Learn on February 26th, where we’ll walk through practical manufacturing scenarios and explore how…
AI in Business Central for Manufacturing: From Automation to Agentic Workflows
Upcoming Lunch & Learn — See AI in Manufacturing Workflows
Join us for a 30-minute Lunch & Learn on February 26th, where we’ll walk through practical manufacturing scenarios and explore how…
Dynamics GP to Business Central: Migration Overview & Considerations
Microsoft Dynamics GP support sunsets on December 31, 2029. After that date, product enhancements, tax and security updates, and mainstream support will be discontinued. As a result, many organizations running…
Why Waiting for Perfect Data Means Never Starting with AI
This post is part of our Microsoft Copilot, Explained series, which starts with everyday productivity tools like email and meetings before expanding into broader workflows and AI agents."Our data isn't…
Manage Consent
To provide the best experiences, we use technologies like cookies to store and/or access device information. Consenting to these technologies will allow us to process data such as browsing behavior or unique IDs on this site. Not consenting or withdrawing consent, may adversely affect certain features and functions.
Functional
Always active
The technical storage or access is strictly necessary for the legitimate purpose of enabling the use of a specific service explicitly requested by the subscriber or user, or for the sole purpose of carrying out the transmission of a communication over an electronic communications network.
Preferences
The technical storage or access is necessary for the legitimate purpose of storing preferences that are not requested by the subscriber or user.
Statistics
The technical storage or access that is used exclusively for statistical purposes.The technical storage or access that is used exclusively for anonymous statistical purposes. Without a subpoena, voluntary compliance on the part of your Internet Service Provider, or additional records from a third party, information stored or retrieved for this purpose alone cannot usually be used to identify you.
Marketing
The technical storage or access is required to create user profiles to send advertising, or to track the user on a website or across several websites for similar marketing purposes.


 Use the Copilot Prompting guide to create more accurate analysis.
 Use the Copilot Prompting guide to create more accurate analysis.
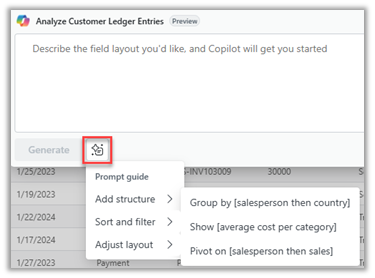
 In the Rename prompt, enter the name, and select Rename.


 On each header, click the menu (represented by three parallel lines) and select the funnel icon. Select or enter the values to filter by.Regular List filters are also available by using the funnel icon on the upper right corner, which is the standard Business Central filters.
 You can sort most columns by clicking the header, which will reverse the sorting to ascending, descending, or no sorting. Ascending and descending sorting are indicated by their corresponding arrows, and no arrow means no sorting.

 Any other non-numerical field, when selected, will become part of the Row Groups, or they can be dragged into the Column Labels section to name the columns. For example, drag the column “Posting Date Years” and BC will display the yearly totals.
 The resulting file is a snapshot of what you see on screen. You can further modify the file and format it as desired.
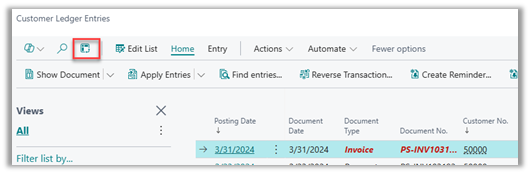
 On each header, click the menu (represented by three parallel lines) and select the funnel icon. Select or enter the values to filter by.Regular List filters are also available by using the funnel icon on the upper right corner, which is the standard Business Central filters.
 You can sort most columns by clicking the header, which will reverse the sorting to ascending, descending, or no sorting. Ascending and descending sorting are indicated by their corresponding arrows, and no arrow means no sorting.
 Any other non-numerical field, when selected, will become part of the Row Groups, or they can be dragged into the Column Labels section to name the columns. For example, drag the column “Posting Date Years” and BC will display the yearly totals.
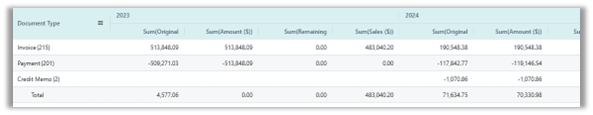
 The resulting file is a snapshot of what you see on screen. You can further modify the file and format it as desired.
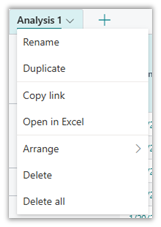
 Freeze left will send the column to the left of the page.
 Freeze right will send the column to the right of the page.


 Freeze left will send the column to the left of the page.
 Freeze right will send the column to the right of the page.